Individualization of Treatment Regimes Based Upon Genetic Profile
Cardiac hypertrophy in response to hemodynamic overload or myocardial injury increases myocardial mass in part by altering gene expression. Messenger RNA profiles for hypertrophy and heart failure are highly conserved between species and critical transcriptional activators of this program, such as MEF2 downstream of Gq, have been well defined. It is increasingly recognized that transcriptional repression acts in concert with transcriptional activation to coordinate expression of genes, and identification of small, non-coding microRNAs (miRs) that negatively regulate production of protein products from messenger RNA (mRNA) transcripts by binding to complementary sequences in the 3’UTR of target mRNAs has provided fresh insight into the basic mechanisms that balance gene expression.
We described a program of cardiac-expressed miRs that are dynamically regulated in human heart failure, analogous to that for mRNAs (Circulation. 119:1263-71, 2009, pdf), and have since used novel deep resequencing techniques combining multiplexed PCR, genetic bar-coding and pooled seqeuncing to examine microRNA targeting in different cardiac diseases (Proc Nat Acad Sci USA. 109:19864-9, 2012, pdf and others). Similar advanced genomics approaches have been developed to examine genetic variation within the exons of genes that cause familial hypertrophic and dilated cardiomyopathies.
Figure 1.
MicroRNA signature of active pressure-overload hypertrophy. (A and B) MicroRNA-Seq results for highly expressed (A) and moderately expressed (B) cardiac microRNAs. Volcano plots (Left) show fold-change TAC/sham vs. P value. Bold horizontal and vertical lines show threshold levels [±25% fold change and P value at false discovery rate (FDR) of 0.02]. Heat maps show unsupervised hierarchical clustering of normalized regulated microRNA sequence data; each column is a single mouse heart. (C) Quantitative levels for all 62 hypertrophy-regulated microRNAs. Sham (white) and TAC (black) are shown as reads per sample. Data are presented as mean ± SEM. (D) Correlation of early hypertrophy-induced changes in 21 representative microRNA levels assessed by miR-Seq vs. RT-qPCR.
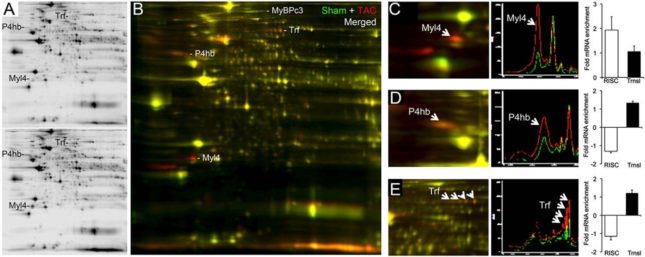
Figure 2.
Changes in the cardiac proteome 1 wk after surgical pressure overloading. (A) Representative 2D differential in-gel electrophoresis showing Cy 3-labeled sham-operated (Upper) and Cy 5-labeled 1-wk TAC (Lower) cardiac proteomes. (B) Merged Cy 3 (green) and Cy 5 (red) images. Regulated myosin-binding protein C (MyBPc3), transferrin (Trf), protein disulfide isomerase (P4hb), and myosin light-chain isoform 4 (Myl4) are labeled. (C–E) Exploded views from a separate experiment of Myl4 (C), P4hb (D), and Trf (E), with accompanying quantifications corresponding to RISC-associated versus total mRNA levels.
![MicroRNA signature of active pressure-overload hypertrophy. (A and B) MicroRNA-Seq results for highly expressed (A) and moderately expressed (B) cardiac microRNAs. Volcano plots (Left) show fold-change TAC/sham vs. P value. Bold horizontal and vertical lines show threshold levels [±25% fold change and P value at false discovery rate (FDR) of 0.02]. Heat maps show unsupervised hierarchical clustering of normalized regulated microRNA sequence data; each column is a single mouse heart. (C) Quantitative levels for all 62 hypertrophy-regulated microRNAs. Sham (white) and TAC (black) are shown as reads per sample. Data are presented as mean ± SEM. (D) Correlation of early hypertrophy-induced changes in 21 representative microRNA levels assessed by miR-Seq vs. RT-qPCR.](https://pharmacogenomics.wustl.edu/wp-content/uploads/2016/07/Figure-1-5-645x556.jpg)